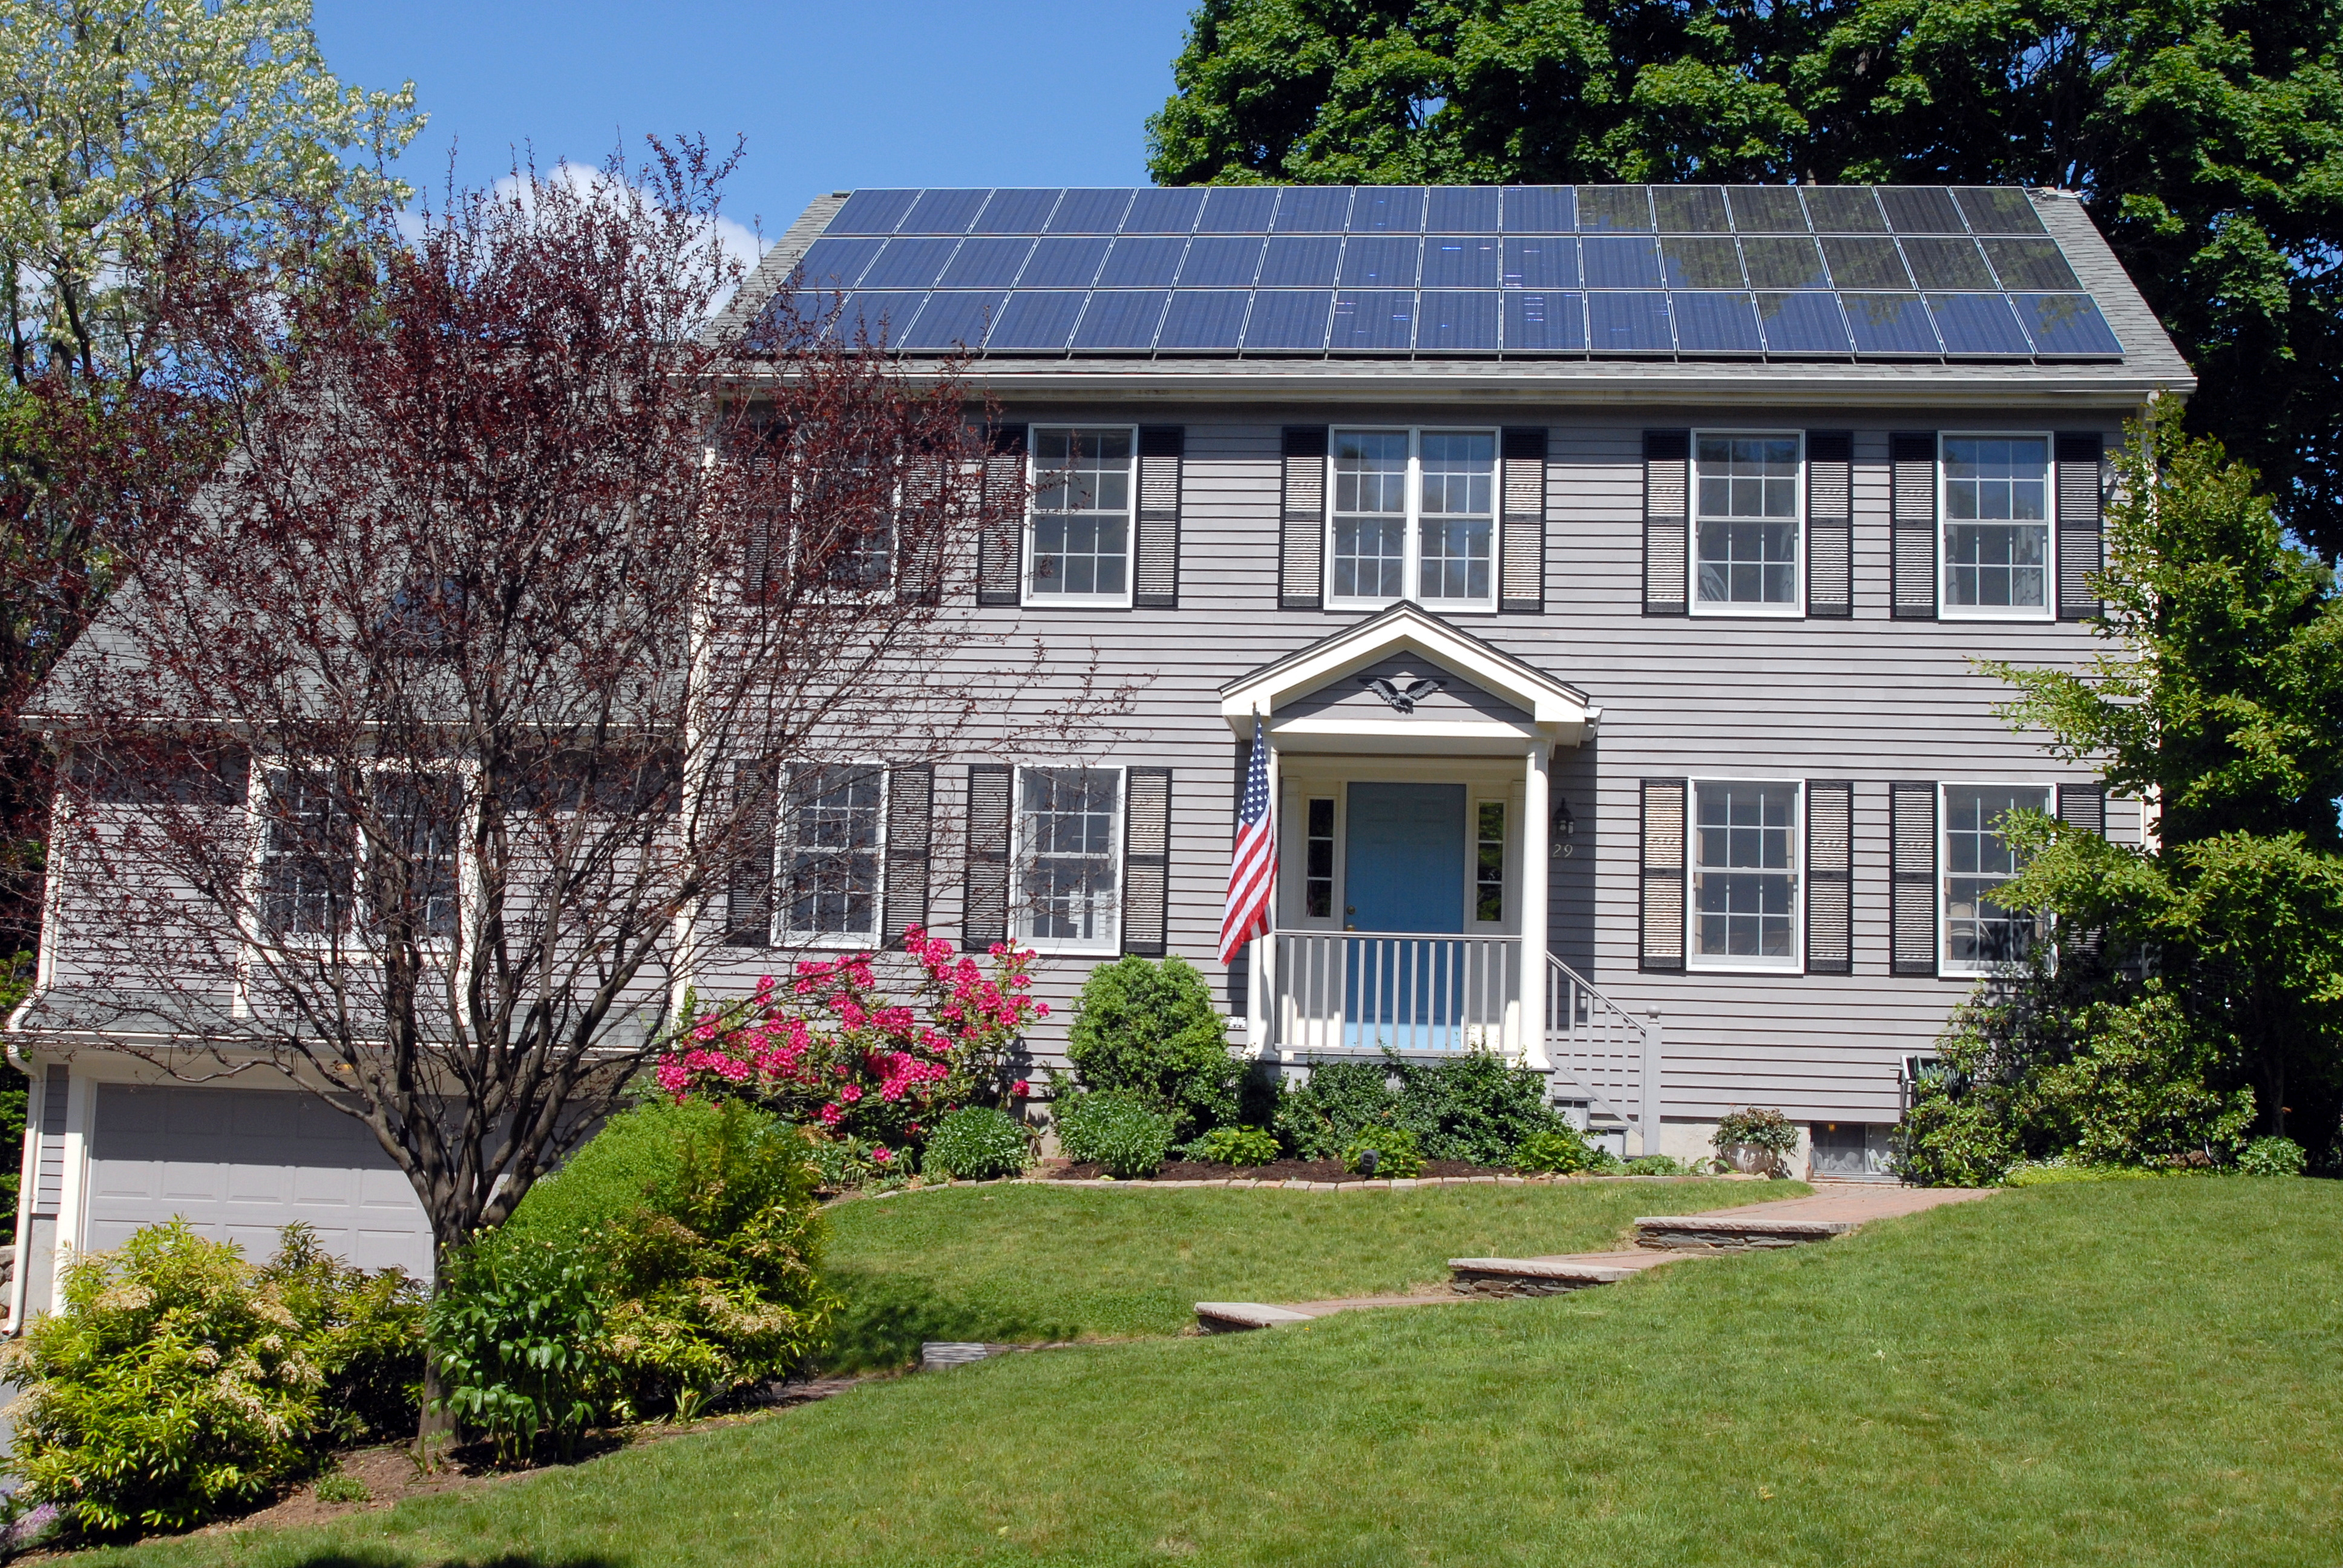
Rooftop solar panels across the United States are now generating nearly five times what they did a decade ago, according to new federal data.
The U.S. Energy Information Administration (EIA) reports that small-scale solar generation — systems smaller than 1 megawatt, the kind installed on homes and small businesses — has climbed from 18,812 gigawatthours to 92,979 gigawatthours over the past ten years.
- 92,979 GWh generated by U.S. small-scale solar in 2025, up from 18,812 GWh a decade ago
- 37% of all U.S. rooftop solar generation came from California alone in 2025
- 25% year-over-year growth in 2022, the single biggest jump of the decade
- 20 gigawatts of installed California rooftop capacity in 2025, up from 18 GW in 2024
Where the growth is happening
California, Arizona, Texas and Florida top the list, largely because they sit in regions with the most abundant sunlight. California alone accounted for 37% of total U.S. small-scale solar generation in 2025, at 34,411 GWh, with installed capacity growing from 18 to 20 gigawatts in a single year.
Texas and Florida show just how fast the picture has shifted. Texas generation grew from 391 GWh in 2016 to 5,408 GWh in 2025; Florida went from 205 GWh to 5,198 GWh over the same stretch, both driven by property tax exemptions and utility-specific incentive programs.
New York is the outlier on the list. Despite sitting in a region with far less sunshine than the Sun Belt states, it ranks as the fifth-largest rooftop solar producer in the country, a result credited to capacity growth supported by technology improvements and the state's NY-Sun incentive program.
The policy effect, visible in the data
Growth was not steady across the decade — it spiked, hard, in 2022. Total generation jumped 25% that year compared with 2021, driven in large part by a rush to install capacity under California's Net Energy Metering (NEM) 2.0 program before it closed to new customers in April 2023.
NEM 2.0 offered homeowners higher compensation for exporting solar power to the grid than its successor, the Net Billing Tariff (NEM 3.0). Crucially, any capacity installed under the old program was grandfathered in at the better rate, which pulled forward a wave of installations ahead of the switch.
Even in a region with lower solar resources, New York ranks as the fifth-largest rooftop solar generation producer as a result of capacity growth supported by technology improvements and state incentives, the EIA noted in its analysis.
Arizona's trajectory tells a similar story on a smaller scale: a 22% jump in generation between 2022 and 2023, before settling to a steadier 6% growth rate in 2025, helped along by a 25% state income-tax credit for rooftop installations.
Why the growth is slowing, not stopping
The EIA's data shows the rate of year-over-year growth has declined since the 2022 peak, even as total generation keeps climbing. That is consistent with a maturing market: the easiest, most incentive-friendly installations have already happened in the biggest states, and newer growth is coming from states like New Jersey, Massachusetts and Illinois layering in their own incentive programs.
To build the estimates, EIA combines utility survey data on the number of customers with rooftop systems and their combined capacity with modeling tools including the National Renewable Energy Laboratory's System Advisor Model and PVWatts, since utilities typically do not directly measure how much power rooftop systems generate. The full breakdown is available in EIA's Today in Energy analysis.


